Absolute Towers
Gaoyang Ye
Arch 653 Project 2

The first thing I did was making a new mass model rather than using the old model. It is because the old model has too many separated curtain panels and they have weak relationship with each other. So I made this new conceptual mass model below. (Left is the new model)


On this mass model, I inserted a surface pattern called "panel 1", which is made in another family. The grid lines were distributed accordingly to having closer value of panel dimensions.
The first try I did was making the color of the facade changing with the sunlight direction. So I started with using Dynamo.

In the first step, I used these nodes to find the curtain panels in the project. In dynamo it is called the element. The central points were located by giving 0.5 value to the U,V value.

Next, I made these nodes to relate the sunlight with the midpoints of the panels. In the list of every value, it has negative and positive values, that is why the absolute node was put in this group.

The third step is to set the color for reflecting the sunlight. I chose blue and red and used a number slider to control the darkness of the color.

This is the last step to realize the color on the building facade.
Here is the result.


The second try was making the color of the curtain panels being able to change according to a semi-auto controlled factor. It's still in Dynamo.


In this group the vector was controlled by two points. These two points are on the diagnal of the panel and the U,V values adding together as 1. The two point have the opposite value of U and V.
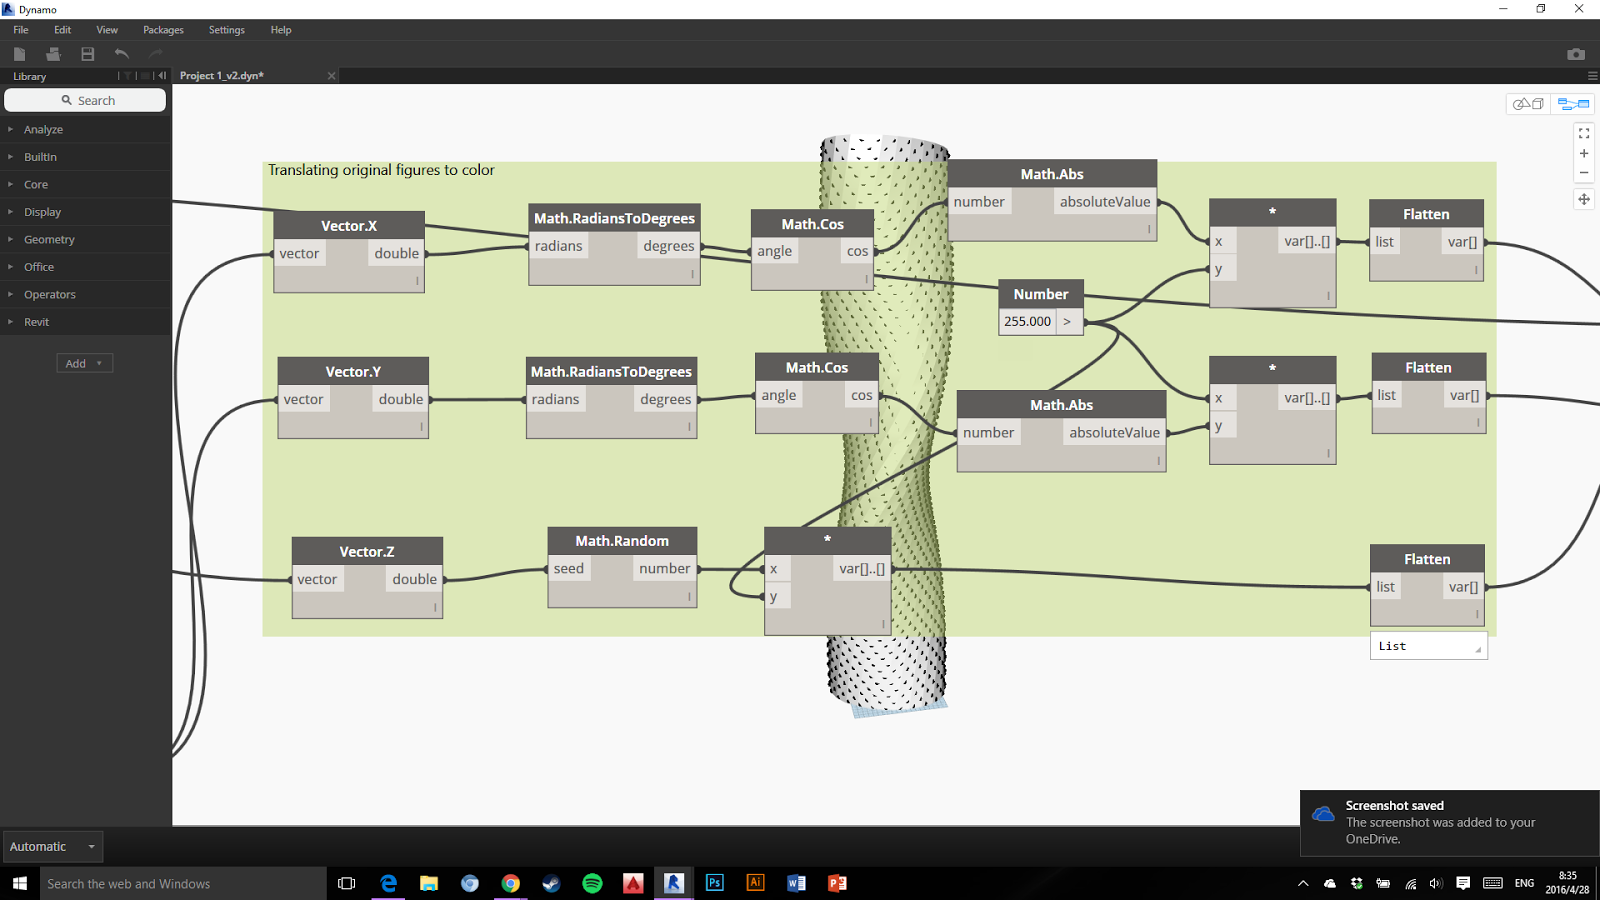
The X and Y values of the vector were translated into a wave defined by a cos formula. Which makes the value varied from 0-1 as they have been changed to absolute value. The Z value was associated with the height of the points because the difference between two points were too small in one panel.

The X, Y values turned into red and blue and the Z value connected to the alpha value.
Here is the result.


没有评论:
发表评论